


What is Spontivly?
Spontivly is a modern data visualization and analytics platform designed for teams who want insights without the headache. It connects to your existing tools and gives you instant dashboards - no coding or data science degree required.
It’s fast, visual, and built for everyone from marketers and community managers to operations leads and executives.
Think: real-time dashboards, seamless integrations, and storytelling through data. All in just a few clicks.

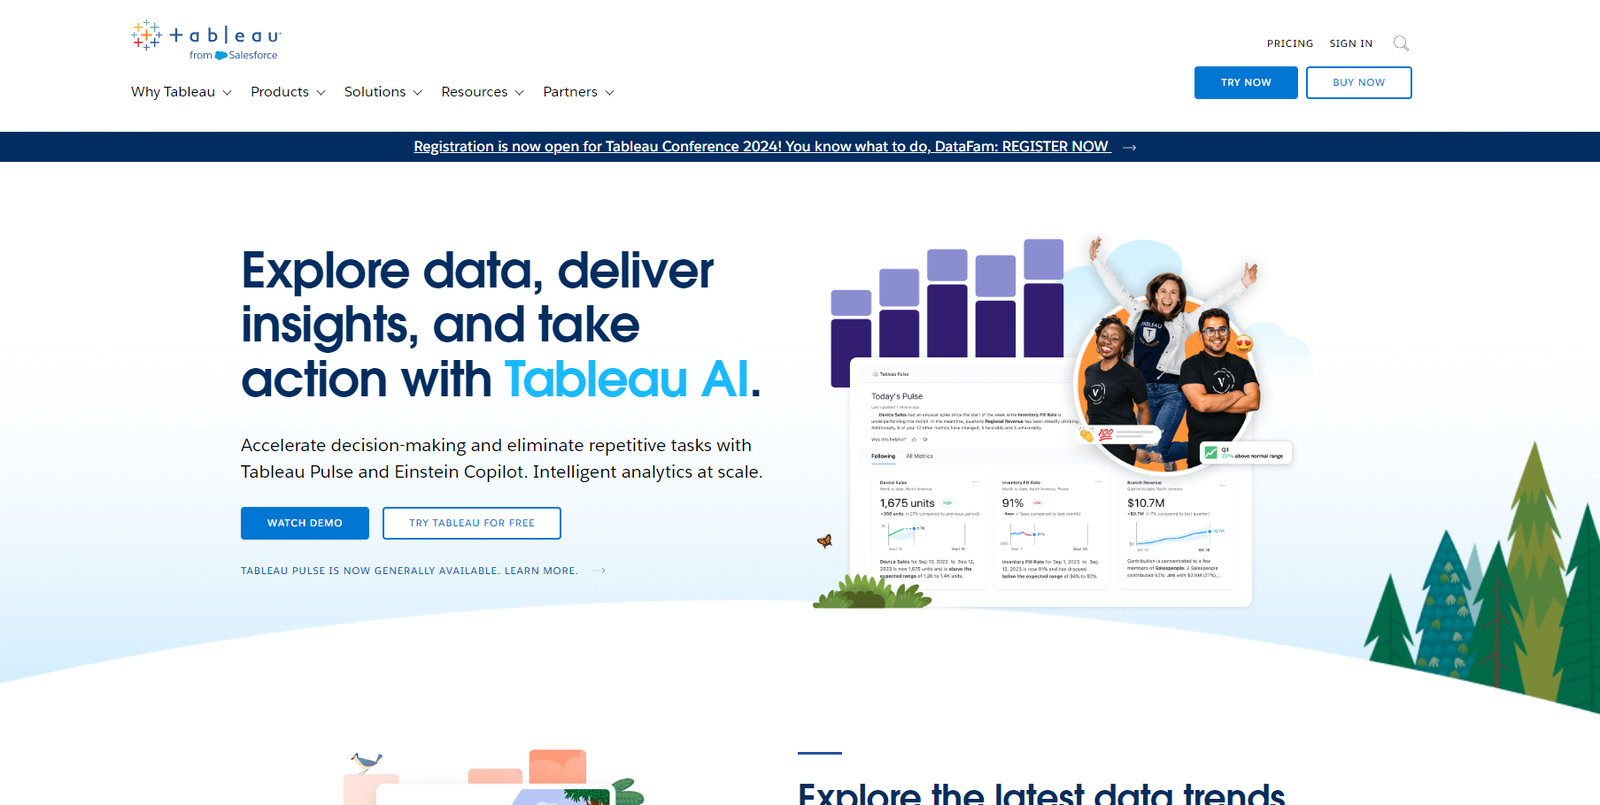
What is Tableau?
Tableau is one of the most well-known data visualization platforms out there. It offers powerful analytics features and helps businesses dive deep into their data.
But as we know with great power comes great responsibility, and, in this case, great complexity paired with a steep learning curve.
Spontivly vs. Tableau: Pros & Cons
✅ Tableau: Pros
- Custom Dashboards: Drag-and-drop interface for creating beautiful visualizations
- Advanced Analytics: Great for data analysts with features like predictive modeling and custom scripts
❌ Tableau: Cons
- Pricing: It can get pricey, especially for small to mid-sized teams
- Learning Curve: Not the easiest tool to master. In depth training is often required and time consuming if you don't already code
Why Choose Spontivly?
Let’s be honest: most data tools weren’t built with non-technical teams in mind. And that’s where Spontivly shines.
Here’s the problem:
- A single dashboard can take weeks to build and cost companies thousands in tools and resources
- Teams want more data, but lack the time, tools, and training to use it
- Data storytelling is often an afterthought
Now here’s the solution: Spontivly
Spontivly tackles three big pain points:
🧰 Tech Simplicity
Easily sync your tools and centralize data with zero setup headaches.
📊 Visualization Made Easy
Build stunning dashboards that actually make sense, even if you’ve never touched a spreadsheet.
📖 Storytelling with Data
Go beyond charts. Use your data to tell a story, show impact, and make confident decisions.
What Can You Do with Spontivly?
Spontivly gives your team the power to turn raw data into real insight - fast. Whether you're building dashboards for internal strategy or sharing impact with clients, it’s built to keep things simple, visual, and accessible.
Here’s what you can do (with zero coding):
- Build Dashboards in Minutes
Create custom dashboards with real-time data, no dev help needed. Perfect for tracking KPIs, campaign performance, or community growth. - Connect Your Tools Instantly
Seamlessly integrate with your most used platforms like CRMs, email marketing, social media, finance, project managemant, and more. - Upload CSVs and Go
Got offline data? Just drag, drop, and visualize. Upload CSV files directly into Spontivly to complete your data story. - Connect to Databases
Pull in live data from your databases to keep everything you need centralized. - Access Hundreds of Metrics
Choose from a growing library of ready-to-use metrics tailored for marketing, operations, sales, Ecommerce, events - you name it. - Share with Customers & Stakeholders
Publish dashboards or reports externally to show value, share insights, and keep clients in the loop without sharing a login. - Embed Anywhere
Drop your dashboards right into your website, internal wiki, or customer portal for seamless visibility.
Final Verdict?
If your team needs an easy, no-code, and fast way to visualize data, Spontivly is your best bet. It's intuitive, scalable, and perfect for modern teams who want insights without complexity.


.svg)


.svg)
